
Why Leadership Scoreboards Often Understate Real Progress
Leadership teams often leave scoreboard reviews feeling that the organization should be moving faster.
The numbers change slightly from one meeting to the next. A metric improves modestly. Another slips. Most of the discussion centers on what did not move enough or what still requires attention. Because the scoreboard is reviewed weekly or monthly, progress is evaluated in short intervals. In those windows the movement rarely appears meaningful.
Short measurement horizons make momentum difficult to recognize.
I have been rowing on a Concept2 erg since 2018. The PM5 monitor records every meter produced during each workout. At the end of a session the number rarely feels significant. Five thousand meters. Ten thousand meters. Occasionally more. The workout ends, the screen resets, and the next session begins.
Over time the machine keeps a different record.
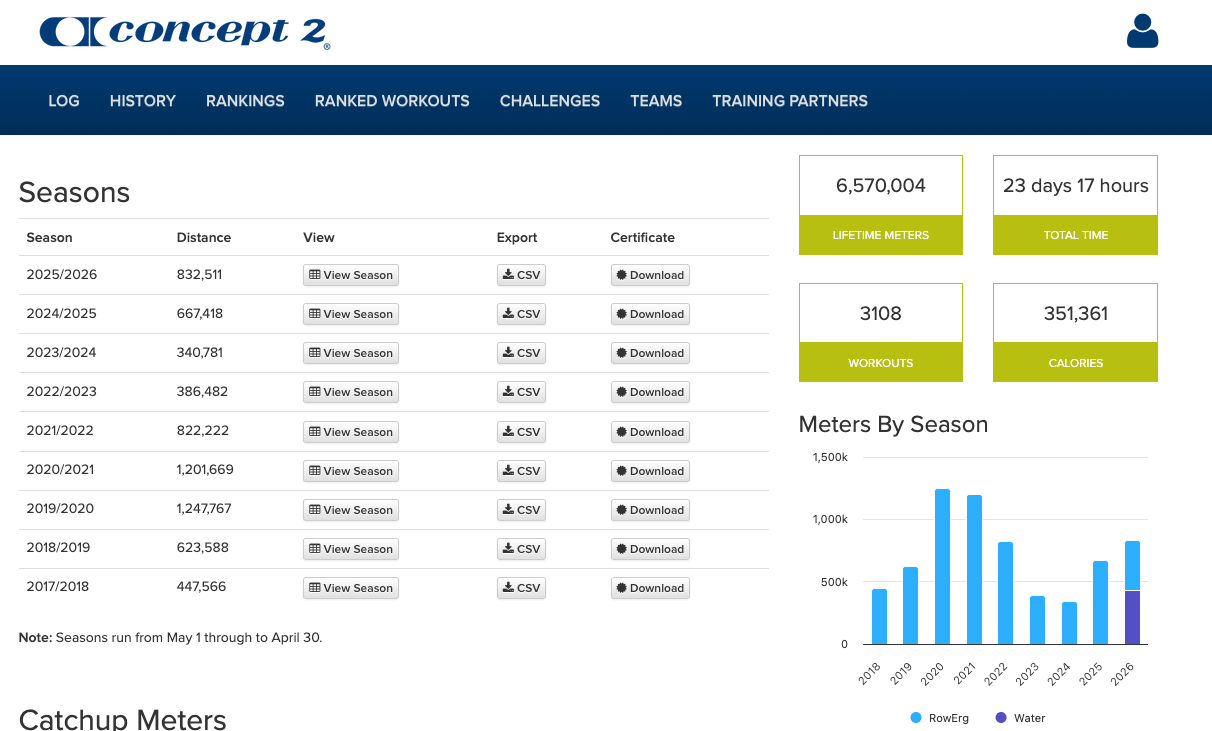
Concept2 lifetime meters recorded since 2018.
Some seasons produced more meters than others. The accumulation continued.
The lifetime meter counter now shows more than 6.5 million meters and is approaching seven million. When I review the seasons, the pattern is uneven. Some years show far more meters than others. Some seasons were highly productive. Others were quieter as work and life shifted. The line does not rise smoothly.
The important part is that the rowing continued.
More recently another color began appearing in the history chart. Some of the meters now come from rowing on the water. When I started rowing in 2018, that was never part of the plan. It emerged gradually through exposure and curiosity. The transition felt similar to the way businesses occasionally discover new operating directions while pursuing their original path.
What makes the Concept2 work is the flywheel.
Each stroke spins a weighted flywheel connected to a fan that generates air resistance. The spinning wheel stores rotational momentum from the previous stroke, allowing the next pull to build on motion already in progress. A single stroke produces very little movement. Repeated strokes compound the energy already inside the system. Over time the rower learns that progress does not come from one powerful pull but from steady repetition applied into a system designed to accumulate momentum.
Healthy businesses often develop momentum in the same way.
A company’s flywheel forms when reinforcing actions begin strengthening each other over time. Clear priorities guide decisions across the leadership team. Aligned teams pursue those priorities consistently. Reliable execution produces results that reinforce the original direction. Each cycle strengthens the next turn of the wheel.
Progress compounds even when each individual action feels small.
The scoreboard records the rotation of that flywheel. Week to week the numbers appear incremental. Some quarters are stronger than others. Some years produce visible progress while others feel more like maintenance. Leadership teams often overestimate what can be accomplished in a single year and underestimate what disciplined repetition can produce across a decade.
Momentum rarely feels dramatic while the wheel is still gaining speed.
Where This Pattern Appears
This pattern appears frequently inside growing companies where leadership teams review operational scoreboards regularly but struggle to connect short-term movement with long-term momentum. In many organizations this disconnect begins appearing while early signals of Drift are already forming inside the operating rhythm.
When performance is evaluated primarily through weekly or monthly results, progress can appear slower than it actually is. Leaders begin questioning whether the organization is moving fast enough even while the underlying operating rhythm continues turning the flywheel. Over longer horizons, however, the accumulated movement becomes visible. Organizations that maintain consistent priorities and disciplined execution gradually build momentum that compounds across years.
The scoreboard eventually reflects the accumulated rotation of the operating system beneath it.
A Simple Place to Start
If this pattern feels familiar inside your organization, it can be useful to step back and examine how clarity, alignment, and execution currently function across the leadership team.
The Baseline Business Assessment provides a simple diagnostic starting point for leadership teams who want to evaluate how their operating rhythm is functioning and where Drift may be forming inside the business.